Many online stores know their revenue, gross margin and return on ad spend, yet still cannot say whether a typical order makes money. The reason is that profitability is spread across teams. Marketing sees acquisition costs. Operations sees fulfillment and shipping. Customer service sees support costs. Finance sees the total at month end, after it is too late to change anything.
E-commerce profitability planning brings those costs together at the level where decisions are made: the order, the customer, the channel and the product. This guide shows how to calculate contribution margin after returns and support, segment it, model promotions and repeat purchases, and choose improvement scenarios.
Why returns and support belong in the margin
Returns are not a rounding error. The National Retail Federation and Happy Returns' 2025 Retail Returns Landscape report, based on surveys of US consumers and of e-commerce professionals at merchants with more than $500 million in revenue, projected that retailers would see 15.8% of annual sales returned in 2025, with an estimated 19.3% of online sales returned. Retailers in the survey expected 17% of holiday sales to come back, and estimated that 9% of all returns were fraudulent.
Each return can carry reverse shipping, handling and inspection costs, items that cannot be resold at full price, payment fees that are not refunded and customer service contacts. A product with a healthy gross margin and a high return rate can lose money on every order.
Step 1: Calculate contribution after returns and support
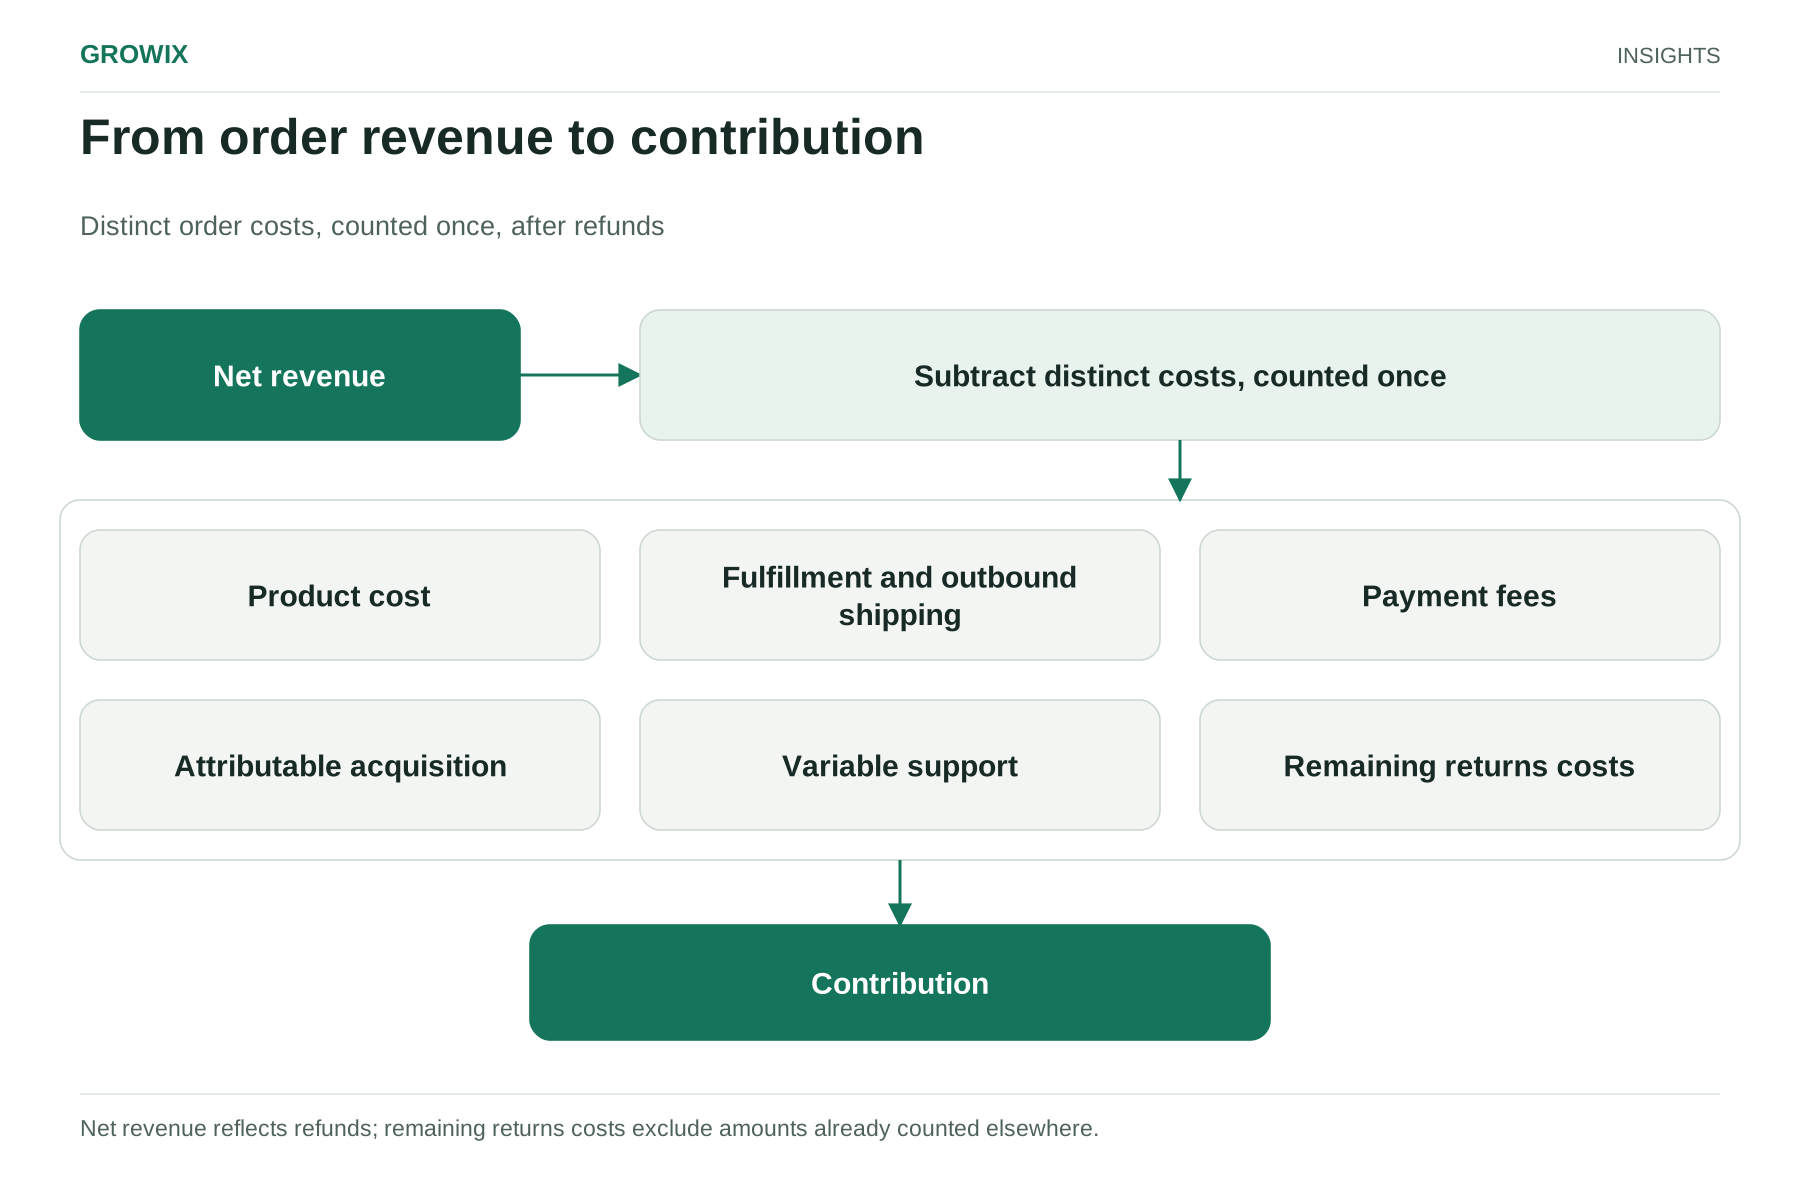
Contribution margin is what remains from revenue after all variable costs of fulfilling an order. A practical e-commerce version has three layers:
- Contribution margin 1: net revenue after discounts and returns, minus cost of goods sold.
- Contribution margin 2: minus payment fees, fulfillment, outbound shipping, return handling and customer support.
- Contribution margin 3: minus marketing costs attributable to the order.
Hypothetical worked example
The following figures are invented for illustration. Replace them with your own data.
A store sells apparel and accessories with an average order value of $80 before returns. Product cost is 40% of retail price. The return rate is 18%, and 80% of returned items can be resold.
| Line (per order) | Calculation | Amount |
|---|
| Gross order value | — | $80.00 |
| Net revenue after returns | $80 × (1 − 18%) | $65.60 |
| Cost of goods sold | Kept items $26.24 plus unsellable returns $1.15 | −$27.39 |
| Payment fees | 3% of $80, assumed not refunded on returns | −$2.40 |
| Fulfillment and packaging | Assumed | −$4.50 |
| Outbound shipping (net of shipping charged) | Assumed | −$7.00 |
| Return handling and reverse shipping | 18% × $11 per return | −$1.98 |
| Customer support | 0.15 contacts per order × $5 per contact | −$0.75 |
| Contribution before marketing | | $21.58 |
Now add marketing. Suppose a new customer costs $35 to acquire, and retention marketing for repeat orders costs about $3 per order.
- First order: $21.58 − $35 = −$13.42. The first order loses money.
- Each repeat order: $21.58 − $3 = $18.58.
- Break-even: a new customer must place about 0.72 repeat orders, on average, to recover the acquisition cost.
If 40% of new customers return within twelve months and those who do place an average of 1.6 repeat orders, the expected repeat orders per new customer is 0.64. Twelve-month contribution per new customer is then about −$1.53. The store is growing revenue while losing a little on each new customer in the first year.
This is a common pattern, and it is not necessarily a problem if customers keep buying beyond twelve months. But it should be a decision, not a surprise.
Where the data comes from
Most stores already hold the data needed; it simply sits in different systems:
| Cost line | Typical source |
|---|
| Revenue, discounts and refunds | Commerce platform and payment processor reports |
| Product cost | Inventory or accounting system, ideally landed cost including inbound freight and duties |
| Payment fees | Payment processor statements |
| Fulfillment and packaging | Third-party logistics invoices or internal labor and materials costs |
| Shipping and return shipping | Carrier invoices, matched to orders where possible |
| Support costs | Helpdesk contact volumes and support team costs, or outsourcing invoices |
| Marketing | Ad platforms, affiliate and agency invoices, matched to new and returning customers |
Start with monthly averages if order-level matching is not yet possible. An approximate model that the whole team trusts is more useful than a precise one that never gets finished.
Allocation choices to agree
A few decisions change the answer, so agree them with finance up front:
- Which costs are variable. Warehouse rent and salaried staff are usually treated as fixed; per-order picking fees and packaging as variable.
- How to treat marketing. Allocate acquisition spend to new customers' first orders, and retention spend to repeat orders, rather than spreading all marketing evenly.
- How to value returned stock. Decide whether items that cannot be sold at full price are written down, discounted or written off.
- Marketplace orders. Marketplace fees, fulfillment programs and return rules differ from your own site, so model them as a separate channel.
Step 2: Segment by channel and product
Averages hide where profit is made and lost. Recalculate the model for segments that matter:
- Acquisition channel: paid social, paid search, affiliates, marketplaces, organic and email often differ widely in acquisition cost, order value and return rate.
- Product category: apparel sizes, fragile goods and high-ticket items have different return and damage profiles.
- First-order product: customers who start with certain products may be more likely to buy again.
- Customer cohort: customers acquired during heavy promotions may behave differently from those acquired at full price.
- Geography: shipping zones and carrier rates change outbound and return costs.
A simple matrix of contribution margin 3 by channel and category usually reveals a few segments that fund the business and a few that drain it.
Promotions
Discounts reduce revenue on every unit while most costs stay the same. In the example above, a 20% discount reduces the price from $80 to $64. After returns, fees and the same fulfillment, shipping and support costs, contribution before marketing falls from $21.58 to about $8.94 per order, a drop of nearly 60%. To earn the same total contribution, the promotion would need to generate roughly 2.4 times as many orders, or bring in customers who are unusually likely to buy again.
Before running a promotion, model three things: the incremental orders it must create, the share of discounted orders that would have happened anyway, and the repeat purchase behavior of customers acquired through discounts. Our Black Friday email and SMS checklist applies this to peak-season campaigns.
Repeat purchase
Repeat purchase is usually the largest lever on e-commerce profitability because it spreads acquisition cost across more orders. Track repeat rate and orders per customer by cohort, and test what moves them: post-purchase communication, replenishment reminders, loyalty benefits and product recommendations.
A cohort table makes this visible. List customers by the month of their first order, then show cumulative contribution per customer at three, six, twelve and twenty-four months. Cohorts that reach break-even quickly show which channels, products and offers attract valuable customers. Cohorts that never reach break-even show where acquisition spending should be reduced, however strong their first-order revenue looked at the time.
Step 4: Choose margin improvement scenarios
With the model built, compare levers by their effect on twelve-month contribution per new customer. Using the same hypothetical store:
| Scenario | Change | Contribution before marketing | 12-month contribution per new customer |
|---|
| Baseline | — | $21.58 | −$1.53 |
| Reduce returns | Return rate from 18% to 14% through better size guidance and product information | $24.19 | +$2.76 |
| Raise order value | Average order value from $80 to $90 through bundles, other costs unchanged | $26.05 | +$5.81 |
| Lower acquisition cost | From $35 to $28 through channel mix | $21.58 | +$5.47 |
| Heavy discounting | 20% off all orders, no change in behavior | $8.94 | −$22.26 |
Each scenario holds other assumptions constant, which real life will not. The value of the table is in ranking levers and starting the right conversations: in this example, returns reduction and order value improvements are worth as much as a substantial cut in acquisition cost.
Practical ways to improve each lever
Returns: clearer size guidance, better product photos and descriptions, fit feedback from reviews, policies that discourage serial returning, exchanges instead of refunds, and fraud checks informed by data on unusual return patterns.
Order value: bundles, thresholds for free shipping set with margin in mind, and relevant add-ons at checkout.
Acquisition: shift budget toward channels and campaigns with the best contribution margin 3, not the best return on ad spend; exclude existing customers from prospecting campaigns.
Support: reduce avoidable contacts with proactive order updates and clear returns information.
Fulfillment and shipping: packaging that fits, carrier negotiation and zone-based shipping strategies.
Common pitfalls
- Judging channels by return on ad spend. A channel with high ad-attributed revenue can still deliver low contribution if it attracts high-return or one-time customers.
- Ignoring the cost of free shipping thresholds. A threshold set without margin data can encourage orders that cost more to ship than they earn.
- Treating returns as an operations problem only. Product descriptions, sizing data and marketing promises drive many returns.
- Counting promotional revenue without baseline sales. Without an estimate of what would have sold anyway, every promotion looks successful.
- Updating the model once a year. Shipping rates, ad costs and return rates move quickly; review monthly and rebuild assumptions quarterly.
Turning the model into a plan
Once the model is in place, use it in annual and quarterly planning. Set targets for contribution per order and per new customer alongside revenue, give each lever an owner and a target, and review progress monthly. When leadership debates a new channel, product line or promotion, ask for its expected effect on contribution margin 3, not only on revenue. Over time, that habit changes which ideas get funded.
Responsibilities
- Finance: the model, data definitions and monthly reporting.
- Marketing: acquisition costs by channel and cohort repeat behavior.
- Operations: fulfillment, shipping and returns costs.
- Merchandising: product-level margin and return drivers.
- Customer service: contact rates and reasons.
- Leadership: trade-offs between growth and margin.
Measures of success
- Contribution margin 2 and 3 per order, by channel and category.
- Twelve-month contribution per new customer, by cohort.
- Return rate and cost per return, by category.
- Repeat purchase rate and orders per customer.
- Acquisition cost by channel, measured against contribution rather than revenue.
Frequently asked questions
What is a good profit margin for e-commerce?
There is no single good number, because margins vary by category, price point and business model. A more useful test is whether each order covers product cost, fulfillment, payment fees, returns and support, and whether each new customer's twelve-month contribution exceeds the cost of acquiring them.
How do you calculate contribution margin for an online store?
Start with net revenue after discounts and returns and subtract product cost (contribution margin 1), then subtract variable fulfillment, payment, returns handling and support costs (contribution margin 2), then subtract marketing costs (contribution margin 3). Calculate it per order, by channel and by product category.
Why do first orders often lose money?
Acquisition cost lands on the first order. In this guide's example, an order contributes $21.58 before marketing, so a $35 acquisition cost makes the first order lose $13.42. Profit then depends on how many customers return and how often they buy again.
Next step
Build the per-order model for your top three channels and top five categories using last quarter's data. Most teams find at least one segment where they are paying to lose money, and one where they are under-investing.
Growix's Financial Planning & Business Modelling team builds the forecasts and models that turn plans into numbers you can manage against, and our Growth Strategy team helps decide where to grow and what to stop. If support costs are a major line in your model, see our guide to outsourced customer support pricing.
Discuss your growth and operating priorities