2027 Growth Planning for B2B SaaS: Aligning Pipeline, Retention and Delivery Capacity
Most SaaS plans fail because the revenue target, pipeline math, retention and delivery capacity were set separately. A worked model that connects them, plus a quarterly review.
Annual planning season in B2B SaaS often follows a familiar pattern. Leadership sets a revenue target. Sales commits to a new bookings number. Marketing commits to a lead number. Customer success inherits whatever is sold. Each plan looks reasonable on its own, but nobody checks whether they add up: whether existing customers will renew and expand as assumed, whether there is enough pipeline to hit new bookings, and whether onboarding and support teams can absorb the customers sold.
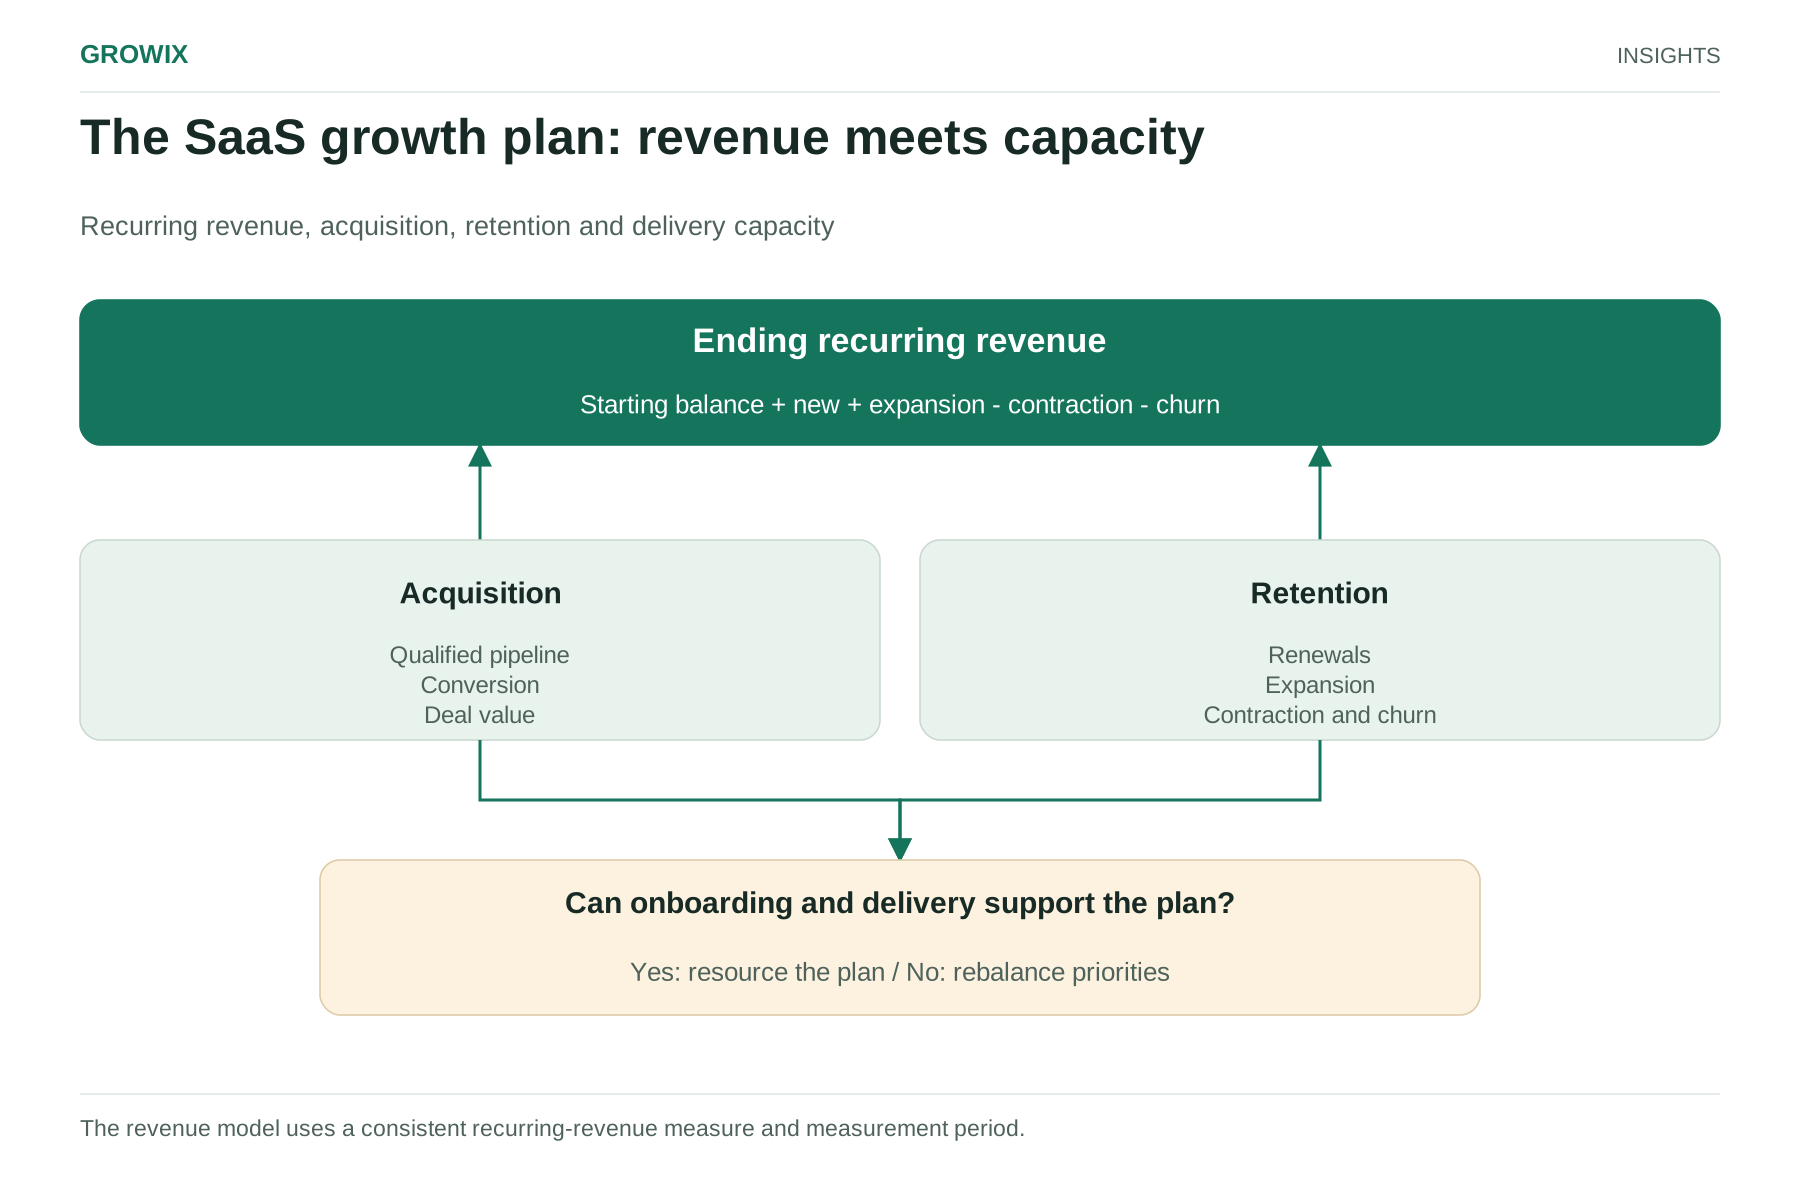
A sound SaaS growth strategy connects those pieces in one model. This guide works through a four-step method for building a 2027 plan: establish a revenue and retention baseline, work backward from the target to pipeline and sales capacity, check delivery capacity, then choose initiatives with owners and a quarterly review with scenarios.
Step 1: Build a revenue and retention baseline
Start with where revenue actually comes from, not with next year's target.
Build an ARR bridge for the last four to eight quarters
An annual recurring revenue (ARR) bridge shows how ARR moved from the start of a period to the end:
Component
Meaning
Starting ARR
Recurring revenue at the start of the period
+ New ARR
From new customers
+ Expansion ARR
Upgrades, added seats, cross-sells to existing customers
− Contraction ARR
Downgrades and reduced seats
− Churned ARR
Customers who left
= Ending ARR
Recurring revenue at the end
From the bridge, calculate two retention rates over a twelve-month cohort:
Gross revenue retention (GRR): starting ARR minus contraction and churn, divided by starting ARR. It shows how well you keep what you have.
Net revenue retention (NRR): starting ARR plus expansion, minus contraction and churn, divided by starting ARR. It shows whether your existing base grows on its own.
Segment before you average
Company-wide retention hides the real story. Break the baseline down by segment, such as customer size, industry, plan, acquisition channel and the year customers joined. Look for segments where retention is strong and acquisition costs are reasonable; those often deserve more investment than the overall average suggests. Segments with weak retention may need a product or onboarding fix before more sales effort.
Agree definitions
Before modeling, agree on definitions with finance, sales and customer success: when ARR counts as new, how multi-year deals and discounts are treated, and what counts as churn. Many planning disputes are definition disputes in disguise.
Step 2: Model pipeline, conversion and sales capacity
Work backward from the target, starting with retention.
Hypothetical worked example
The figures below are invented for illustration. Use your own baseline.
A B2B SaaS company starts 2027 with $10 million in ARR and targets $14 million by year end.
Retained and expanded base. Assuming net revenue retention of 105%, existing customers will contribute $10.5 million by year end.
New ARR needed. $14 million minus $10.5 million leaves $3.5 million to come from new customers.
New customers. At an average annual contract value of $35,000, that is 100 new customers.
Qualified opportunities. At a 20% win rate from qualified opportunity, the company needs 500 qualified opportunities to close within the year, created early enough to account for a sales cycle of roughly four months.
Sales capacity. If a fully ramped account executive closes $700,000 of new ARR a year, the plan needs the equivalent of five fully ramped sellers. New hires do not count fully: if ramp takes four months at half productivity, hiring must happen early or the capacity will not exist when it is needed.
Test the sensitivity
Now change one assumption. If net revenue retention is 100% instead of 105%, existing customers contribute $10 million, new ARR needed rises to $4 million, and the company needs about 114 new customers and 571 qualified opportunities. A five-point difference in retention adds roughly 71 opportunities to the pipeline requirement.
Each percentage point of net revenue retention on a $10 million base is worth $100,000 of ARR. That is why retention initiatives deserve a place in a growth plan alongside acquisition.
Check pipeline sources
Break the 500 opportunities down by source: inbound marketing, outbound sales development, partners and expansion referrals. For each source, check whether historical conversion rates and capacity support the number. If inbound has never produced more than 150 qualified opportunities a year, a plan that assumes 300 needs a credible explanation. Our guide to SEO vs PPC for B2B lead generation covers how to model channel economics.
Step 3: Check delivery capacity
This is the step most plans skip. New customers need onboarding, implementation, support and ongoing customer success. If those teams are overloaded, onboarding slips, early experience suffers and the retention assumption in step 1 fails.
Continuing the example:
Onboarding and implementation. If each new customer needs 40 hours of implementation work, 100 customers need 4,000 hours. At about 1,600 productive hours per person a year, that is 2.5 full-time people for new customers alone, before expansion projects.
Customer success. If the company's model assigns roughly $2 million of ARR to each customer success manager, $14 million of year-end ARR implies about seven people, hired ahead of the ARR they will manage.
Support. Contact volume usually grows with customer count and product complexity. Use the past year's contacts per customer to forecast.
Product and engineering. Commitments made to win deals, such as integrations or features, consume capacity and need to be in the product plan.
If capacity falls short, the plan must change: hire earlier, reduce implementation effort through better onboarding design, adjust the target, or change the mix of customers sold.
The SaaS growth plan: revenue meets capacity. The revenue model uses a consistent recurring-revenue measure and measurement period. View full size
Step 4: Choose initiatives with owners
With the model built, decide which initiatives will close the gap between what happens on current trends and the target. Strong initiatives are specific, owned and measurable:
Initiative
Owner
Leading indicator
Expected effect
Reduce early churn with a redesigned onboarding program
Head of customer success
Time to first value; 90-day product adoption
GRR in the first-year cohort
Launch a partner channel with two integration partners
Head of partnerships
Partner-sourced qualified opportunities
New ARR from partners
Introduce usage-based expansion pricing for a higher tier
Head of product and finance
Accounts approaching usage limits
Expansion ARR
Focus outbound on the highest-retention segment
Head of sales
Meetings booked in target segment
New ARR and future retention
Limit the list. A handful of initiatives with clear owners is more likely to deliver than a dozen that compete for the same people.
For each initiative, write down three things before approving it: the assumption it changes in the model (for example, first-year GRR rising from 88% to 92%), the people and budget it needs, and the date by which a leading indicator should show whether it is working. Initiatives that cannot be connected to a line in the model are usually activities rather than strategy. Initiatives that need the same scarce people, often product managers or senior engineers, should be sequenced rather than run in parallel.
Set a quarterly review and scenario plan
An annual plan built in November is out of date by March. Agree in advance how you will review and adjust it.
Build three scenarios. A base case, a downside case (for example, lower win rates and retention) and an upside case. For each, note which hires or spending would change.
Define triggers. Decide which leading indicators, reviewed monthly, will trigger a change: pipeline coverage for the next two quarters below an agreed level, a retention cohort trending below plan, or onboarding backlog above a threshold.
Pre-agree decisions. For example: if qualified pipeline for the second half is below plan by the end of April, defer two sales hires and redirect budget to proven channels. Decisions made calmly in advance are better than decisions made under pressure in September.
Run a quarterly business review that compares the ARR bridge, pipeline and capacity against plan, and updates the forecast and scenarios.
A practical planning calendar
For a company on a calendar fiscal year, a workable sequence looks like this:
When
Activity
Early November
ARR bridge, cohort retention analysis and agreed definitions
Mid-November
Leadership workshop on target, segments and strategic priorities
Integrated model, scenarios, initiative list with owners and budget
Mid-December
Board or investor review; final adjustments
January
Quotas, hiring plan and initiative kick-offs; first monthly indicator review
Leave time between steps for teams to challenge assumptions. A plan presented as finished before sales, customer success and product have tested it rarely survives the first quarter.
Common planning mistakes
Setting the target first and reverse-engineering optimistic assumptions to meet it, such as win rates or retention that have never been achieved.
Counting new sellers as fully productive from their start date.
Ignoring seasonality in bookings and renewals, so the plan assumes even quarters that history does not support.
Treating retention as customer success's problem rather than a shared result of product, onboarding, pricing and sales fit.
Planning hires without recruiting lead time, so capacity arrives after the quarter that needed it.
Leaving pricing out of the plan, even though packaging and price changes often move expansion revenue faster than new acquisition.
Communicating the plan
The board and the wider company need different versions of the same plan. For the board, show the ARR bridge, the key assumptions with their historical basis, the scenarios and the decisions each would trigger. For teams, translate the plan into a small number of goals each function can influence directly, with the leading indicators they will see every month. Everyone should be able to explain how their work connects to the ARR bridge.
Revenue operations foundations
The model is only as good as the data behind it. Revenue operations work that supports planning includes consistent opportunity stages and definitions, clean data on contract values and renewal dates, attribution of opportunities to sources, and dashboards that show the ARR bridge, pipeline coverage and capacity in one place. If these foundations are weak, fixing them in the first quarter is itself a growth initiative.
Responsibilities
CEO and leadership team: target, strategy and trade-off decisions.
Finance: the model, scenarios and budget.
Sales and marketing: pipeline sources, conversion assumptions and capacity.
Customer success and support: retention assumptions, onboarding and service capacity.
Product: roadmap commitments and pricing changes.
Revenue operations: definitions, data and reporting.
Measures of success
Ending ARR versus plan, explained through the ARR bridge.
GRR and NRR by cohort and segment.
Pipeline coverage for the next two quarters.
Sales capacity: ramped seller equivalents versus plan.
Time to first value for new customers and onboarding backlog.
Forecast accuracy at each quarterly review.
Frequently asked questions
What is a SaaS growth strategy?
A SaaS growth strategy is the plan for how recurring revenue will grow: how much comes from retaining and expanding existing customers, how much from new customers, which segments and channels deliver it, and what sales, onboarding and support capacity is needed to make the numbers achievable.
What is net revenue retention (NRR)?
Net revenue retention is starting ARR plus expansion, minus contraction and churn, divided by starting ARR, usually measured over a twelve-month cohort. Above 100% means the existing base grows on its own. On a $10 million base, each percentage point of NRR is worth $100,000 of ARR.
How do you build a SaaS revenue plan for 2027?
Start with an ARR bridge and retention baseline by segment, work backward from the target to the new business, pipeline and sales capacity required, check onboarding and support capacity, choose a short list of initiatives with owners, and agree quarterly reviews with base, downside and upside scenarios.
Next steps
Before your planning workshop, build the ARR bridge for the last eight quarters and agree definitions with finance, sales and customer success. That single step makes the rest of the plan more honest.
Growix's Growth Strategy team helps leadership set priorities and decide what to stop doing, and our Go-to-Market & Revenue Operations team builds the revenue engine, processes and reporting behind the plan. For choosing the goal framework that carries the plan, see OKRs vs KPIs.